Why Are Groceries So Expensive? What the Numbers Actually Say
Why are groceries so expensive when inflation is near 2%? Because prices never fell — EU food costs about 30% more than in 2020. The data, explained.
Also on grocery costs: 12 ways to spend less on food · budgeting when prices keep rising · work out your own food budgetGroceries are expensive because food prices in Europe rose roughly 30% between 2020 and today, and — this is the part nobody says out loud — they never came back down. When the news says "inflation has fallen to 2%," it means prices are now rising slowly from the new, much higher level. The surge wasn't cancelled. It was made permanent, quietly, and your supermarket receipt is the only place that admits it. I build a receipt-scanning app for a living, which means I spend an unhealthy amount of time looking at what individual groceries actually cost. This article is the data I wish someone had shown me in one place: what happened to food prices, why the official number and your trolley disagree, and what — realistically — you can do with that information.
The number on the news is answering a different question
There are two different questions hiding inside "how bad is inflation?", and almost all public conversation is about the wrong one for your purposes. The news quotes the rate: how fast prices are rising compared to a year ago. That number looks great now. Euro-area food inflation peaked above 15% in March 2023 — it had already hit 13.8% by December 2022 — and by April 2026 it was back to a sleepy 2.2%. Mission accomplished, apparently. Your trolley answers the level: what things cost now versus what they used to cost. That number never recovered. Working from Eurostat's annual figures, food prices ended up around 31% above their 2020 level, while prices overall rose about 24%. Food didn't just ride the inflation wave — it outran it.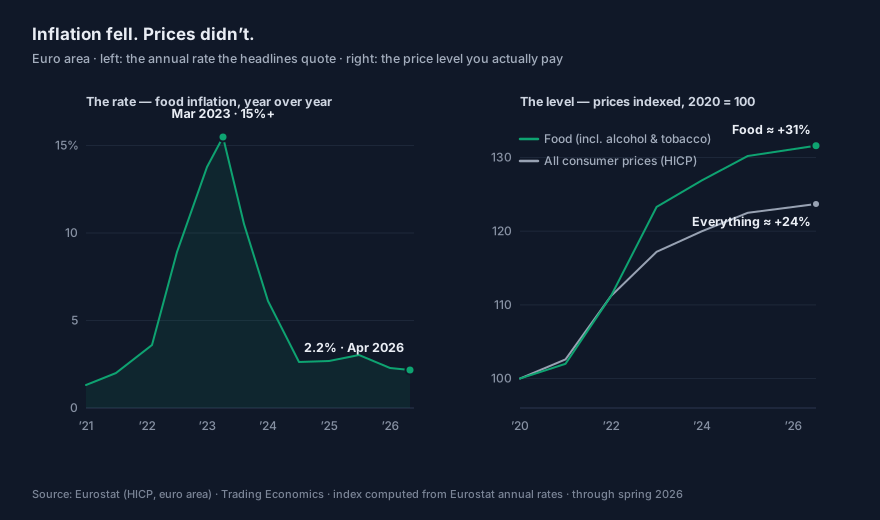 Both panels describe the same shop shelves. The left one is what politicians and central bankers talk about, because it's the thing they can influence. The right one is what your budget experiences, because budgets are paid in levels, not rates.
Once you see this distinction, a lot of confusing conversations make sense. "Inflation is under control" and "I can't afford groceries anymore" are both true at the same time. Falling inflation was never going to make anything cheaper — it only made things get more expensive more slowly.
Both panels describe the same shop shelves. The left one is what politicians and central bankers talk about, because it's the thing they can influence. The right one is what your budget experiences, because budgets are paid in levels, not rates.
Once you see this distinction, a lot of confusing conversations make sense. "Inflation is under control" and "I can't afford groceries anymore" are both true at the same time. Falling inflation was never going to make anything cheaper — it only made things get more expensive more slowly.
Why are groceries so expensive right now?
Food prices in the EU rose about 30% between 2020 and 2026 — driven by the energy shock after Russia's invasion of Ukraine, fertiliser costs, poor harvests, and droughts — and prices almost never fall back after a surge like that. Current inflation of around 2% means groceries are still getting more expensive, just slowly, on top of everything that already happened. The uncomfortable detail is that "food inflation is 2%" compounds on the new base. A basket that went from €100 to €130 and now rises 2% a year isn't healing. It's €132.60 next year, €135.25 the year after. The ratchet only turns one way.The averages hid the products that hurt
"Food rose 30%" is itself an average, and averages are where the pain hides. Eurostat's own product-level data from the peak of the surge shows how uneven it really was: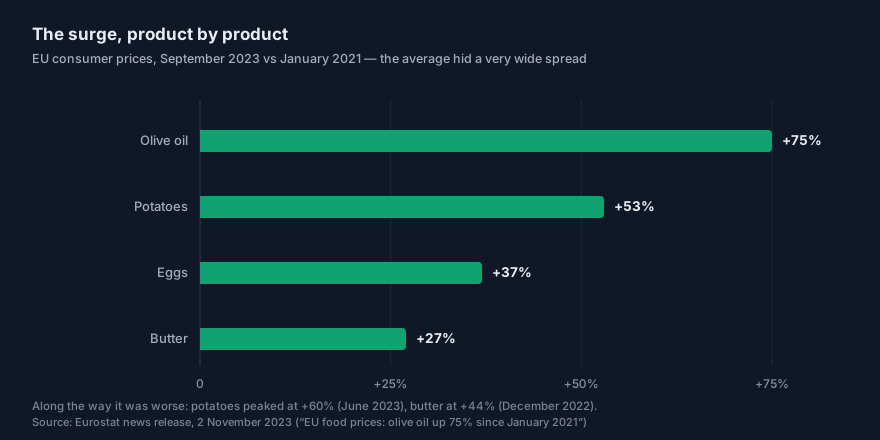 Olive oil was 75% more expensive in September 2023 than in January 2021. Potatoes peaked at +60%. And in one twelve-month stretch, sugar rose 61% — a single year.
So if your cooking leans on olive oil, eggs and butter, you personally lived through far worse than the official 30%. Someone who eats out constantly and rarely cooks barely noticed. Both of you read the same headline number and one of you concluded it was lying.
And the churn hasn't stopped — it's just changed products. The 2025 figures look like this:
| Product (EU, 2025) | Price change |
|---|---|
| Chocolate | +17.8% |
| Frozen fruit | +13% |
| Beef and veal | +10% |
| Eggs | +8.4% |
| Butter | +8.3% |
| Sugar, jam and honey | +6.8% |
| Fresh whole milk | +5.7% |
| Potatoes | −5.2% |
| Sugar | −11% |
| Olive oil | −22.9% |
Two honest observations from that table. First, prices can fall — olive oil dropped 22.9% in 2025 as harvests recovered, though it remains far above 2021. Second, while average food inflation for 2025 was a calm 2.8%, chocolate quietly rose eighteen percent. There is always a chocolate. The average will always hide it.
Olive oil was 75% more expensive in September 2023 than in January 2021. Potatoes peaked at +60%. And in one twelve-month stretch, sugar rose 61% — a single year.
So if your cooking leans on olive oil, eggs and butter, you personally lived through far worse than the official 30%. Someone who eats out constantly and rarely cooks barely noticed. Both of you read the same headline number and one of you concluded it was lying.
And the churn hasn't stopped — it's just changed products. The 2025 figures look like this:
| Product (EU, 2025) | Price change |
|---|---|
| Chocolate | +17.8% |
| Frozen fruit | +13% |
| Beef and veal | +10% |
| Eggs | +8.4% |
| Butter | +8.3% |
| Sugar, jam and honey | +6.8% |
| Fresh whole milk | +5.7% |
| Potatoes | −5.2% |
| Sugar | −11% |
| Olive oil | −22.9% |
Two honest observations from that table. First, prices can fall — olive oil dropped 22.9% in 2025 as harvests recovered, though it remains far above 2021. Second, while average food inflation for 2025 was a calm 2.8%, chocolate quietly rose eighteen percent. There is always a chocolate. The average will always hide it.
Your basket is not the average basket
The official inflation number is built from a giant standardised basket — hundreds of items weighted by what the average household buys. It is methodologically sound and completely unlike your actual life. You don't buy the average basket. You buy your basket, and your basket has habits. If yours is heavy on the products in the tables above, your personal inflation ran well ahead of the official rate for years. This isn't a conspiracy; it's arithmetic. The CEPR calls this the "perceived inflation wedge" — households genuinely experience different inflation from the statistic, partly because of what they buy and partly because of how noticing works. That second part is measurable. The ECB's own Consumer Expectations Survey has tracked it since 2020: on average, people perceive inflation about 1.2 percentage points higher than the measured rate. As of June 2026, consumers put the past year's inflation at 3.6% — while the measured rate sat near 2%. People aren't imagining things; they're sampling differently. You buy milk fifty times a year and a laptop once every five. Price rises in frequently bought items dominate your impression of inflation, and food is the most frequently bought category there is. So the gap between "the news" and "your receipt" has three honest components: food genuinely outran overall inflation, your particular basket may have outrun food, and your attention weights the painful items hardest. None of those make you bad at maths. Two of them make the official number structurally unable to describe your life.The packet shrank while the price stayed still
There's a fourth component, and it's the sneakiest: some of the inflation never appeared on the price tag at all.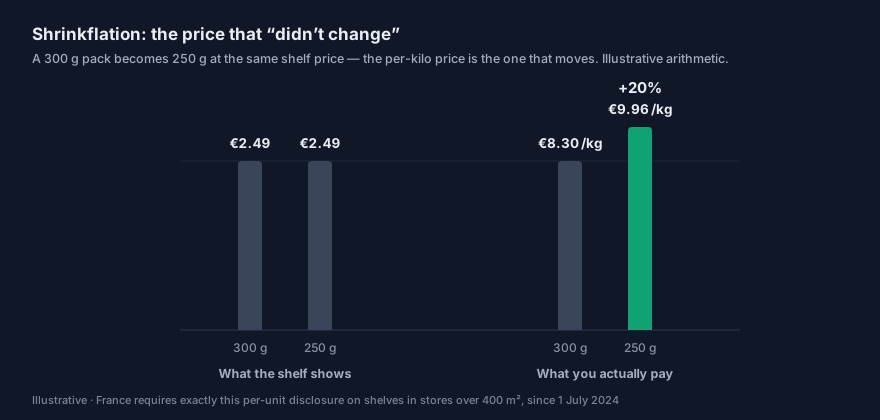 A pack drops from 300 g to 250 g while the shelf price stays €2.49. Nothing looks different. But the per-kilo price just jumped 20%, and unless you read the tiny unit-price line on the shelf label, that increase is invisible. Statisticians do catch this — HICP tracks unit quantities — but shoppers mostly don't, which is exactly why manufacturers do it.
France got annoyed enough to legislate. Since 1 July 2024, French supermarkets over 400 m² must display a notice on shrunk products, in the same font size as the price, for two months:
A pack drops from 300 g to 250 g while the shelf price stays €2.49. Nothing looks different. But the per-kilo price just jumped 20%, and unless you read the tiny unit-price line on the shelf label, that increase is invisible. Statisticians do catch this — HICP tracks unit quantities — but shoppers mostly don't, which is exactly why manufacturers do it.
France got annoyed enough to legislate. Since 1 July 2024, French supermarkets over 400 m² must display a notice on shrunk products, in the same font size as the price, for two months:
"For this product, the quantity sold has decreased from X to Y and its price per [unit] has increased by …%."That a G7 country needed a decree to force this sentence onto shelves tells you how effective the tactic was. I've written a full guide to spotting shrinkflation — the short version is that the unit price (€/kg, €/L) is the only number on the shelf that can't be gamed by resizing the packet.
Paying by card blurs it further
One more mechanism, this one about perception rather than prices. In a famous MIT experiment, Drazen Prelec and Duncan Simester auctioned basketball tickets and found that people instructed to pay by credit card bid 64–113% more than people instructed to pay cash — for identical tickets. The paper is bluntly titled "Always Leave Home Without It." That was an auction, not a supermarket, so carry the caveat. But the underlying effect — paying electronically dulls the "pain of paying" that makes spending memorable — has held up across decades of research, and it interacts badly with everything above. Prices ratcheted up 30%, the packs shrank, and meanwhile the act of paying became a one-second tap that leaves no memory at all. Of course the receipt total feels like a surprise. Every mechanism in this article is pushing in the same direction: you're supposed to not quite notice.What actually helps
I'll be honest about the boundaries first: you cannot budget your way out of a continent-wide price level shift. Food costs what it costs. But the gap between the official number and your personal number is information you can act on, and most people never collect it. Find your personal inflation rate. Take one fixed basket — the ten things you buy every single week — and compare what it cost you a year ago against today, using old receipts or your banking app. That number, not the ECB's, is your budget's reality. If you don't have last year's receipts, start keeping this year's; twelve months from now you'll know exactly what your food inflation is. Rebase the grocery budget to what food costs now. A grocery budget set in 2023 isn't a budget anymore, it's a wish — and missing it every month teaches you to ignore budgets in general. If you want a starting figure grounded in current Eurostat prices for your own country, I built a grocery budget calculator for Europe — most calculators online use US Department of Agriculture figures, which are useless here. Then see rebasing a budget when prices keep rising; the one-line version is: protect the essentials at their real current prices and take the cut somewhere honest instead. Watch unit prices, not pack prices. The €/kg line defeats shrinkflation, own-brand comparisons, and "family size" packaging maths all at once. It's the single highest-value habit on this list and it costs three seconds per shelf. Track at the item level, not the category level. "Groceries: €480" tells you nothing actionable — it can't distinguish the price of milk rising from a quiet slide into premium snacks. Item-level tracking is tedious by hand, which is precisely why I built receipt scanning into Portofelo (my app, so weigh that recommendation accordingly): point the camera at the receipt and every line item lands in its own category. Whatever tool you use — an app, a spreadsheet, a notebook — the goal is the same: know which specific items are eating the increase, because that's the only level at which substitution decisions can be made. Audit the drift, not just the prices. Some of your grocery creep isn't inflation at all — it's small upgrades that compound. Item-level history is what lets you tell the two apart, and they need different fixes.Will grocery prices ever go back down?
Broad grocery prices almost never return to their old levels — economists call sustained falling prices deflation, and central banks actively prevent it because it destabilises economies. What realistically happens is that specific products fall back as their supply problems resolve (olive oil dropped 22.9% in 2025 after two catastrophic harvest years), while the overall level keeps inching up by a percent or two a year. So the practical answer: the 2020 price list is gone, permanently. Waiting for it to return is not a strategy. Adjusting the budget to current reality, and catching the individual products that are still moving, is.Is shrinkflation still happening in 2026?
Yes — shrinkflation remains a standard industry tactic in 2026, particularly in categories with expensive inputs like chocolate, which rose 17.8% in 2025 on cocoa costs even before any pack resizing. France's mandatory shelf notices (in force since July 2024) made it visible there, but most EU countries still have no disclosure requirement, so the unit price remains your only reliable defence. The pattern to expect: whenever a commodity spikes — cocoa now, sunflower oil in 2022, sugar in 2023 — the products containing it shrink about a year later. The commodity price falls back; the pack size rarely does.Why does my grocery bill feel higher than the official inflation rate?
Because it probably is higher, and your perception exaggerates the rest. Food inflation genuinely outran overall inflation (roughly +31% vs +24% since 2020), your personal basket may lean on products that rose far more than the food average, shrinkflation hid part of the increase inside smaller packs, and research shows frequently purchased items dominate how we perceive inflation — the ECB finds people consistently perceive about 1.2 points more inflation than is measured. The only way to separate "prices rose" from "I'm buying differently" is your own receipt history. The official statistics can't do it for you — they've never seen your basket.Where this leaves you
You weren't wrong. That's the summary. The receipt was telling the truth the whole time: food is about a third more expensive than in 2020, the number on the news was answering a different question, part of the increase was hidden inside shrinking packets, and both the statistics and the payment technology were accidentally built to keep you from feeling it clearly. The counter-move isn't outrage, it's bookkeeping. Your receipts are the one dataset about food prices that's actually about you — and whether you collect them with my app, a spreadsheet, or a shoebox, they're the difference between arguing with an average and knowing your own number.Sources and data
- Eurostat — EU food prices: olive oil up 75% since January 2021 (November 2023)
- Eurostat — Annual inflation stable at 2.1% in the euro area (December 2025)
- Prelec & Simester — "Always Leave Home Without It", Marketing Letters (2001)
E
I build Portofelo, an offline-first expense tracker for iPhone. I've spent more hours than I'd like to admit inside other people's budgeting apps, and I write about what actually works.
All articles by Elena Marek →Related articles
Start tracking your finances today
Portofelo makes budgeting and expense tracking effortless. Free to download.
Get Portofelo Free